Nowadays applications are becoming more and more complex and consist of an increasing number of technologies. Monitoring them can be a hard nut to crack, especially on the cloud. Even for quite simple data warehouse with ETL/ELT pipelines you should be able to monitor database, orchestrator, processing engine etc. Luckily GCP platform has a nice monitoring & alerting service. To this tutorial the HTTP Cloud Function has been created

GCP Logging
Monitoring cannot be done without proper logging. GCP provides you with the good quality of logs for the GCP services and enables you to add your own application logs e.g., python logs in Cloud Function processing. They can be easily searched using nice user interface (UI):

Applications logs are extremely important for debugging and creating log-based metrics which later can be used to monitor our GCP environment.
Metrics
GCP provides a huge number of metrics to monitor out of the box including both native services like BigQuery, Cloud Function, Composer etc. and services like AWS, Kubernetes. Just look at the charts with CF executions.

There is also a way of creating our own metrics based on logs which be later used in monitoring & alerting. Monitoring metrics from multiple projects is also available by using scoping projects.
Log based metrics
Logs can be used to create counters, distributions or Boolean metrics. At the beginning the most useful can be the first two which can be used to:
- count the number of logs meeting a particular condition or distribution e.g., number of started jobs
- track job execution time and its historical distributions
Creating metrics enables also adding labels to metrics, however it needs to be used carefully as the storage can grow rapidly, so also the cost. Below you can find an example log-based metric counting Cloud Function traceback messages (errors).Things worth to notice:
- metrics cannot be calculated for historical logs
- new metrics are visible right away in metrics explorer, but they can be inactive for some time until new logs fulfilling the metric conditions are processed

Monitoring with GCP
GCP enables you to monitor your application in multiple ways by using Cloud Monitoring or Error Reporting services. They are extremely useful and can be used separately depending on your use case.
Cloud Monitoring
Cloud Monitoring enables collecting & monitoring GCP metrics which later can be viewed through dashboards. The metrics can be analyzed separately, in groups or even for services through defined SLO (Service Level Objective). The services can be added manually if they are not discovered automatically.
Dashboards
The first level of metrics analysis can be observed by dashboards visualizations. Multiple types of charts will help you to monitor the overall status of your environment & applications. An example chart using created log-based metric can be found below:

GCP Alerting
GCP Alerting is a powerful feature that helps you proactively monitor your applications and systems by setting up alerting policies. These policies notify you when specific conditions are met, such as unusual metric values or missing metrics, ensuring you can address issues before they escalate.
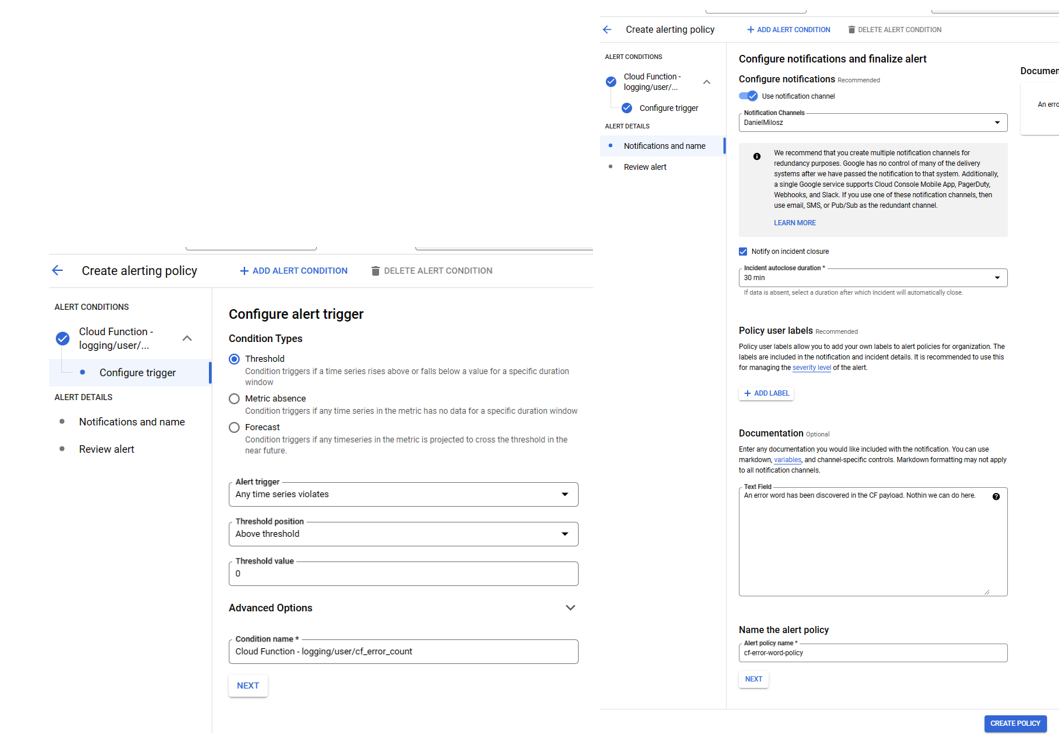
Dashboards are extremely useful tools for day-to-day monitoring of your application; however, it will not inform you about sudden failures – alerting will be necessary for this purpose. An alerting policy can be set up to raise an alert in case some conditions are met, e.g., the metrics indicate something unsettling about the system or the metric is missing at all for a few minutes. Firing an alert creates a ticket which needs to be managed and can also send a notification to the stakeholders through multiple channels like slack or email. The ticket provides information on what went wrong and the ability to quickly navigate to related metrics/logs. Creating an alert policy can be done in just a few steps.First you need to describe the metric you want to monitor:

Afterwards the information about the trigger and notification method must be provided.
Once created, when there is a problem, you will receive an email as below.

You can also go to alerts/incidents and easily navigate to proper logs connected with the issue:

Uptime checks
Uptime check is another easy way of application monitoring. Thanks to it you can verify your service availability. Even private IPs and/or services can be monitored, however there are some restrictions. In the worst case the check on missing metrics can be set up to fire an alert. In the following example we verify our company webpage.

As you may see after few minutes all the checks are passing

GCP Error Reporting
GCP Error Reporting allows you to monitor your environment for errors, which are automatically aggregated into groups for easier management. This feature helps you quickly identify new types of errors and take action when needed.
GCP enables you also to monitor your environment for errors which later are aggregated into groups. This allows you to easily discover new kinds of errors and react if needed.

It is worth noting that the UI is user friendly, and you can go into application logs with just a few clicks. The following picture shows detailed information about the group of errors:

It is worth mentioning that for the service to detect application errors, the logs must contain stack trace or be the ReportedErrorEvent object.
The Future of Data Engineering – Trends to Watch in 2025
What is the reliability of data? Definition and Examples
Test Driven Development in Python using Pytest
Want observability built in from day one? We help teams design reliable cloud data solutions on Google Cloud.


.webp)