Introduction
An integral part of developing software is receiving and analyzing the information produced by code. Sometimes it’s a simple log like “Application is running” or “Function started”. However, we can also get information about critical errors that stop the application.
To be able to generate such messages, collect and analyze them you have to attach logging to the application you developed.
Mostly, logs are saved to a text file that can be easily parsed. This kind of solution works best when an application is in the development stage. The application doesn’t have users, so the number of logs isn’t that large and saving all logs in a text file allows for easy analysis.
The situation is completely different when our application reaches users. There may be thousands of them (and that is what I wish us). Then saving logs in a text file won’t be the best solution. Our logs will contain crucial information such as the number of users per second, number of errors, function operation time, and so on. Fortunately, the ELK toolkit, i.e. Elasticseach, Logstash and Kibana, which is one of the most popular log management systems, comes to the rescue. In this article, I will present what ELK can be used for, what are the benefits of using this toolkit, what it consists of and how to implement ELK in your project.
What is ELK
ELK is a set of tools that allows you to store, analyze and visualize logs. When we properly join ELK with our application, we can stream logs coming from users, which gives us full control over what is currently happening in our application, how many users are currently using it, how long they wait for the results and in the case of too long response time we can increase the required computing resources.
To better understand how the ELK works let’s figure out what exactly ELK abbreviation means:
Elasticsearch - It’s an open-source search and analytics engine that is built on Apache Lucene. It allows you to store and analyze quickly huge amounts of text data.
Logstash - It’s free and open-source software that collects data from various sources, transforms and sends it.
Kibana - It’s a free application that provides data visualization and exploration for data. Kibana offers features such as different types of diagrams that allow presenting data in a convenient and easily-understood way.
Dummy python project with Flask
First of all, let’s write a simple python project using Flask that has two functions. The first function is say_hello which has one argument “name” and returns a greeting message. The second function is app_info which simply returns information about application status.app.py
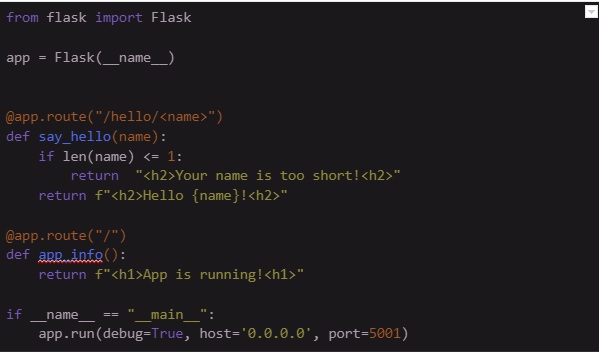
To run the application you can write this command in your console.

Let’s go to the web browser to check if the application is running correctly.
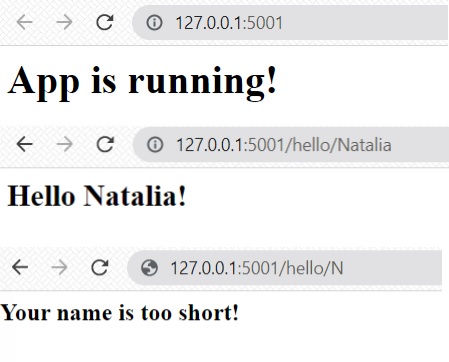
Want to know more? Improve your python code quality - click here.
Run ELK using Docker
In my opinion, the best approach to set up the ELK system is to do that using Docker. You can simply use ready docker images from the Dockerhub (https://hub.docker.com) and run them using the docker-compose file. Firstly, we need to prepare configuration files. In the example below I want to show the basic ELK configuration that let us send, store and visualize logs. Of course, there are a lot more settings that could improve the ELK system. For more information visit the official ELK documentation (https://www.elastic.co/guide/index.html).
elasticsearch.yml

In the elasticsearch.yml file we set cluster name, network host, discovery type, type of xpack license and for example purpose, we disable the xpack security.
kibana.yml

The kibana.yml file consists server name, server host and elasticsearch host.
logstash.yml

In the logstash.yml file there is only information about the HTTP host.
logstash.conf
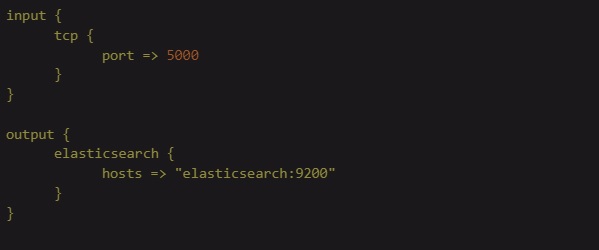
The logstash.conf file consists of information about how logs will be received by logstash (input) and where the logstash will send them (output). In this case, logs will be sent to logstash by TCP using port 5000 and logstash will send them to the elasticsearch using elasticsearch:9200 host.
When all configuration files are prepared it’s high time to write a docker-compose.yml that will run all components of the ELK system. However, we have to discuss a few things before it:
- Communication - Elasticsearch, Logstash and Kibana need network to communicate with each other. We have to ensure a bridge network that works exactly like a bridge between those components.
- Images and ELK version - In this example, we will use the 7.14.4 ELK version.
- Needed ports:
- Elasticsearch uses port 9200 for requests and port 9300 for communication between nodes in the cluster.
- Logstash needs port 5000 for TCP communication and port 9600 for web API communication.
- To access Kibana through a web page we will use port 5601.
Let’s collect all those information in the docker-compose file.
docker-compose.yml
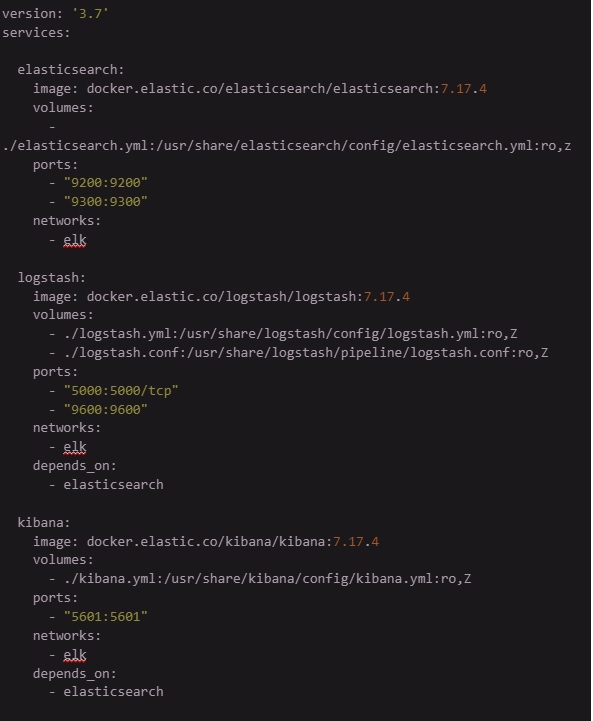

To check the correctness of docker-compose.yml file we have to run it using the command:

And after few seconds let’s go to the web page 127.0.0.1:5601 to check if ELK system works.
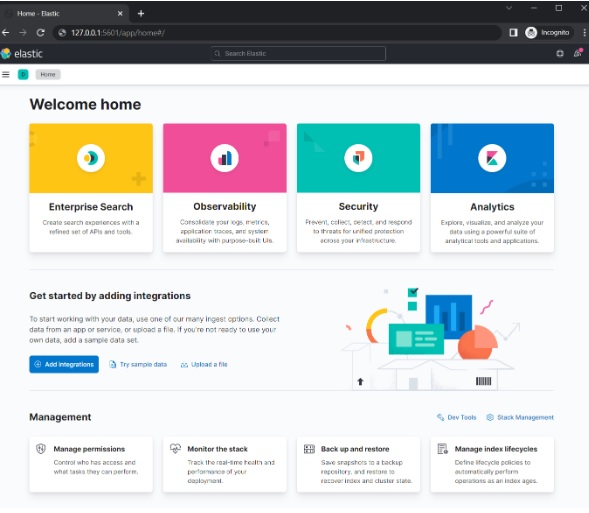
Add logging to the python app
If the ELK system works correctly, we have to add some logs to the app.py script. Remember that we want to send those logs to the Logstash, so AsynchronousLogstashHandler is needed. Let’s look at the code snippet below to figure out how to configure logging properly.
app.py
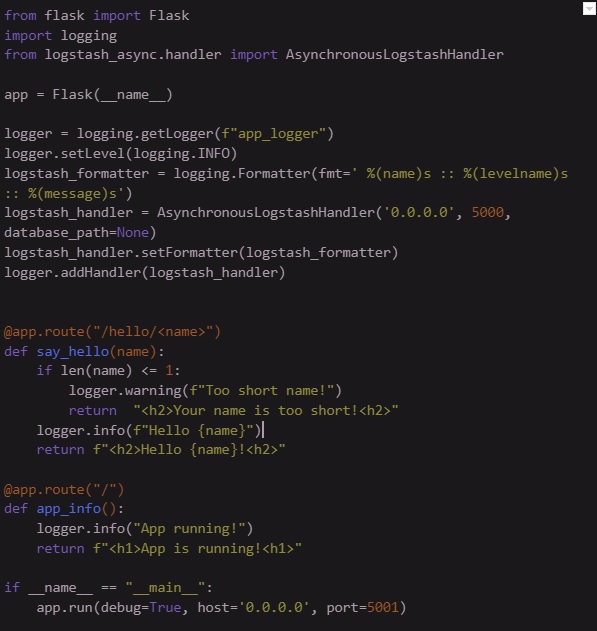
When logging is added run app.py and produce some logs by visiting 127.0.0.1:5001, 127.0.0.1:5001/hello/Natalia and 127.0.0.1:5001/hello/N web pages.
See logs stream in the Elastic
Go to the Home menu and select Observability -> Logs
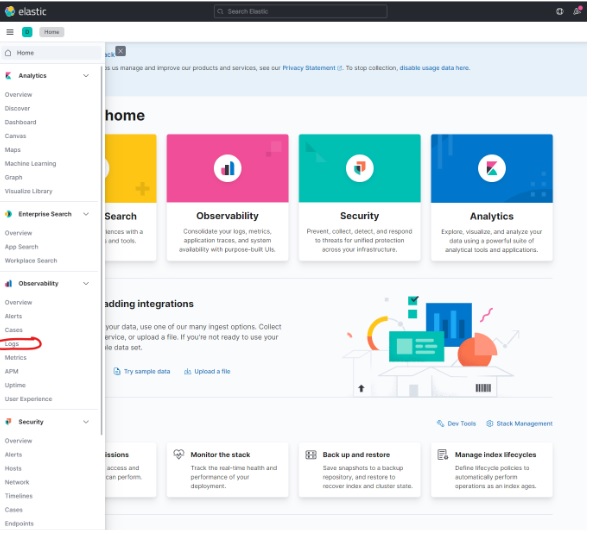
Click Settings
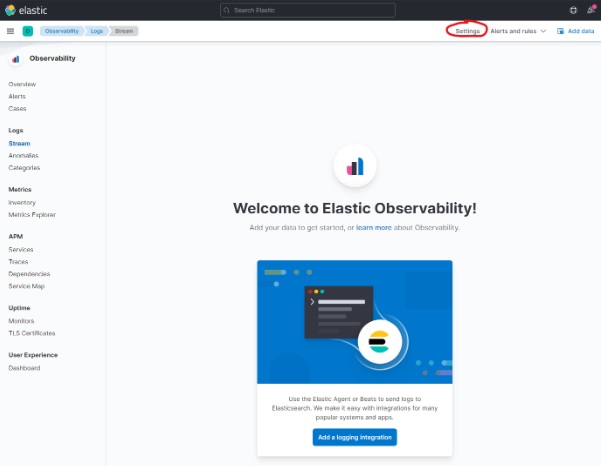
In the Indices section add log* in the Log indices box.

Click Apply and come back to the Observability -> Logs panel.

And voilà! Logs from app.py are added. From now every log produced by app.py will be streamed to the ELK system and visible in the Stream pane.
Conclusion
Logging allows you to control the state of an application, which is very important, especially when it is used by users. The ELK toolkit allows you to easily collect and analyze logs. As proved in the article, the configuration of the ELK system using Docker is not that difficult. I hope I encouraged you to use the ELK system in your applications.
Check out our blog for more details on Big Data:


