Capture Databricks’ cells truncated outputs
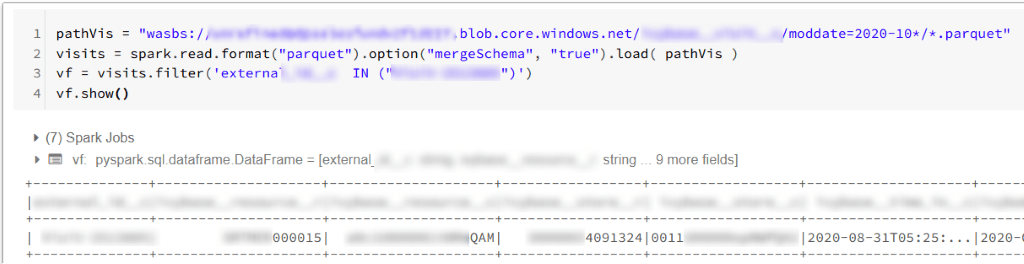
When we run a Capture Databricks’s cell within the Azure environment, we usually get some output from the cell. It can look like this:
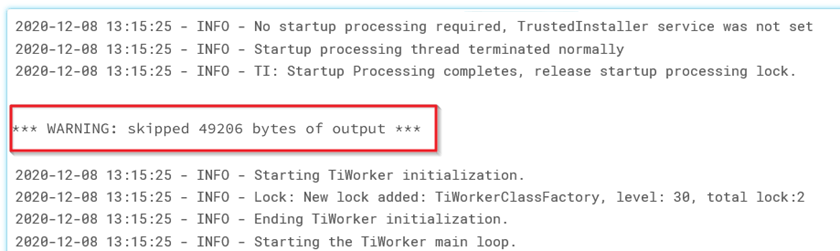
Most often we will not encounter an issue with such an approach. Unfortunately, there are cases, when Capture Databricks will remove some parts of the output. It will happen when our script will generate hundreds of lines in the output. If a size of such long output will exceed Databricks’s threshold (estimated limit: 128 kB), the notebook will return truncated output. When the output is not carrying important information – we might be okay with that. At other times – we might need to extract some valuable information from the output and the truncation will ruin the effects of our script or will prevent us from knowing the actual output of the notebook.
In our case, we hit upon this issue when executing large ingestion jobs connecting to Planorama API and Salesforce API. Below we can see an example of a truncated output:
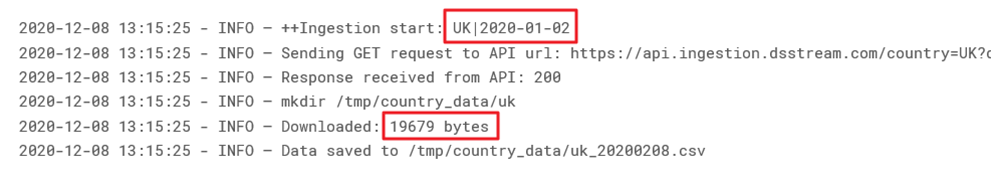
Our output was returning hundreds of lines of output but only a few lines were meaningful. We wanted to extract three pieces of information: country code, day, and download size for that country and day. Below is an example of the output containing these pieces of information:
The solution to the problem of truncated output is placing somewhere within our script a code-snippets for:
- intercepting all the output,
- parsing this output and storing aside the information we need
- finally showing an HTML report.
Using the HTML for a report is a valuable hack providing us with an extra method of showing information under a cell that won’t be truncated by capture Databricks.
Need help with Capture Databricks? Check our Data Engineering Services and see how we can help your business
How to hack truncated outputs problem with HTML :3-Step Process to Capture Databricks Outputs
Handling truncated outputs in Databricks can be challenging, especially when dealing with large ingestion jobs. To effectively capture Databricks outputs and avoid losing valuable information, you can follow this 3-step process:
1. Intercepting the output
The first thing we need to do is to place the below code, somewhere before the main script starts:
from IPython.utils.capture import CapturedIOcapture = CapturedIO(sys.stdout, sys.stderr)
this will prepare a variable Capture Databricks (with a property stdout) which will contain the cell’s output. Later we can refer to this variable’s properties whenever we want to check the current output.
We also prepare an additional list for storing the output during the ingestion’s progress:
WholeOutput = []
2. Parsing the output and storing the information to Capture Databricks Outputs
In this step, using the aforementioned variable capture.stdout, we can capture Databricks outputs and extract meaningful information. This allows us to parse the output and store only the relevant data for further use.
For example, in our case, we used the following script (crucial variables were highlighted) to extract key details like country codes, dates, and download sizes. The script was injected into the ingestion loop, enabling us to extend the WholeOutput list with the parsed data:
def simplified_log(log): return [i for i in log.splitlines() if 'Downloaded' in i \ or 'Ingestion start' in i]# browse through the OUTPUT and get download sizes for the report: key, report = '', {}WholeOutput.extend(simplified_log(capture.stdout))for l in WholeOutput: l = re.sub(r".*?\+\+Ingestion start: ", "*", l) # extract CountryCode (1:3) and date (4:14) if l.startswith('*'): key = l[1:3] + ' - ' + l[4:14] if "INFO – Downloaded:" in l: # cut the string removing only download size l = re.sub(r".*?root - INFO - Downloaded: (.*)", r"\1", l) report[key] = l.strip() # store only the download size
3. Showing the report
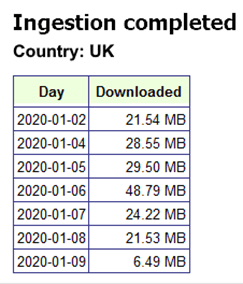
The final stage is showing the HTML report – as mentioned before – this method is an independent form of outputting the information under an individual cell and Databricks truncating the output will not tamper with our report.
Our project used the below, simple function for showing the report:
def showReport(self): html = ['''<!DOCTYPE HTML><BODY> <h2>Ingestion completed </h2> <p> COUNTRY: <b>{} </b></p> <table><tr><th>Date</th><th>Downloaded</th></tr>'''.format \ (", ".join(self.countries).upper())] for key in list(self.report.keys()).sort(): size = self.report[key] html.append("<tr><td>" + key + '</td><td>' + size + "</td>") html.append("</table> </BODY> </HTML>") displayHTML("\n".join([x for x in html if type(x) != type(type)]))
The above method produces the report, which is shown at the end of each loop iteration – giving us frequent feedback on the ingestion progress:
Managing large data sets in databricks partitioning z ordering auto optimize and more